2 minutes
COVID-19 Visualization
We are living the history. COVID-19 has been spreading the world for more than 3 months. It originally started in China. At his moment, more than 100 countries has been affected by the virus.
We will use the following formula a lot in this post.
$$ Current + Recovered + Death = Confirmed $$
Flexdashboard
I create a shiny app in DigitalOcean with my own shiny server. It’s saved here.
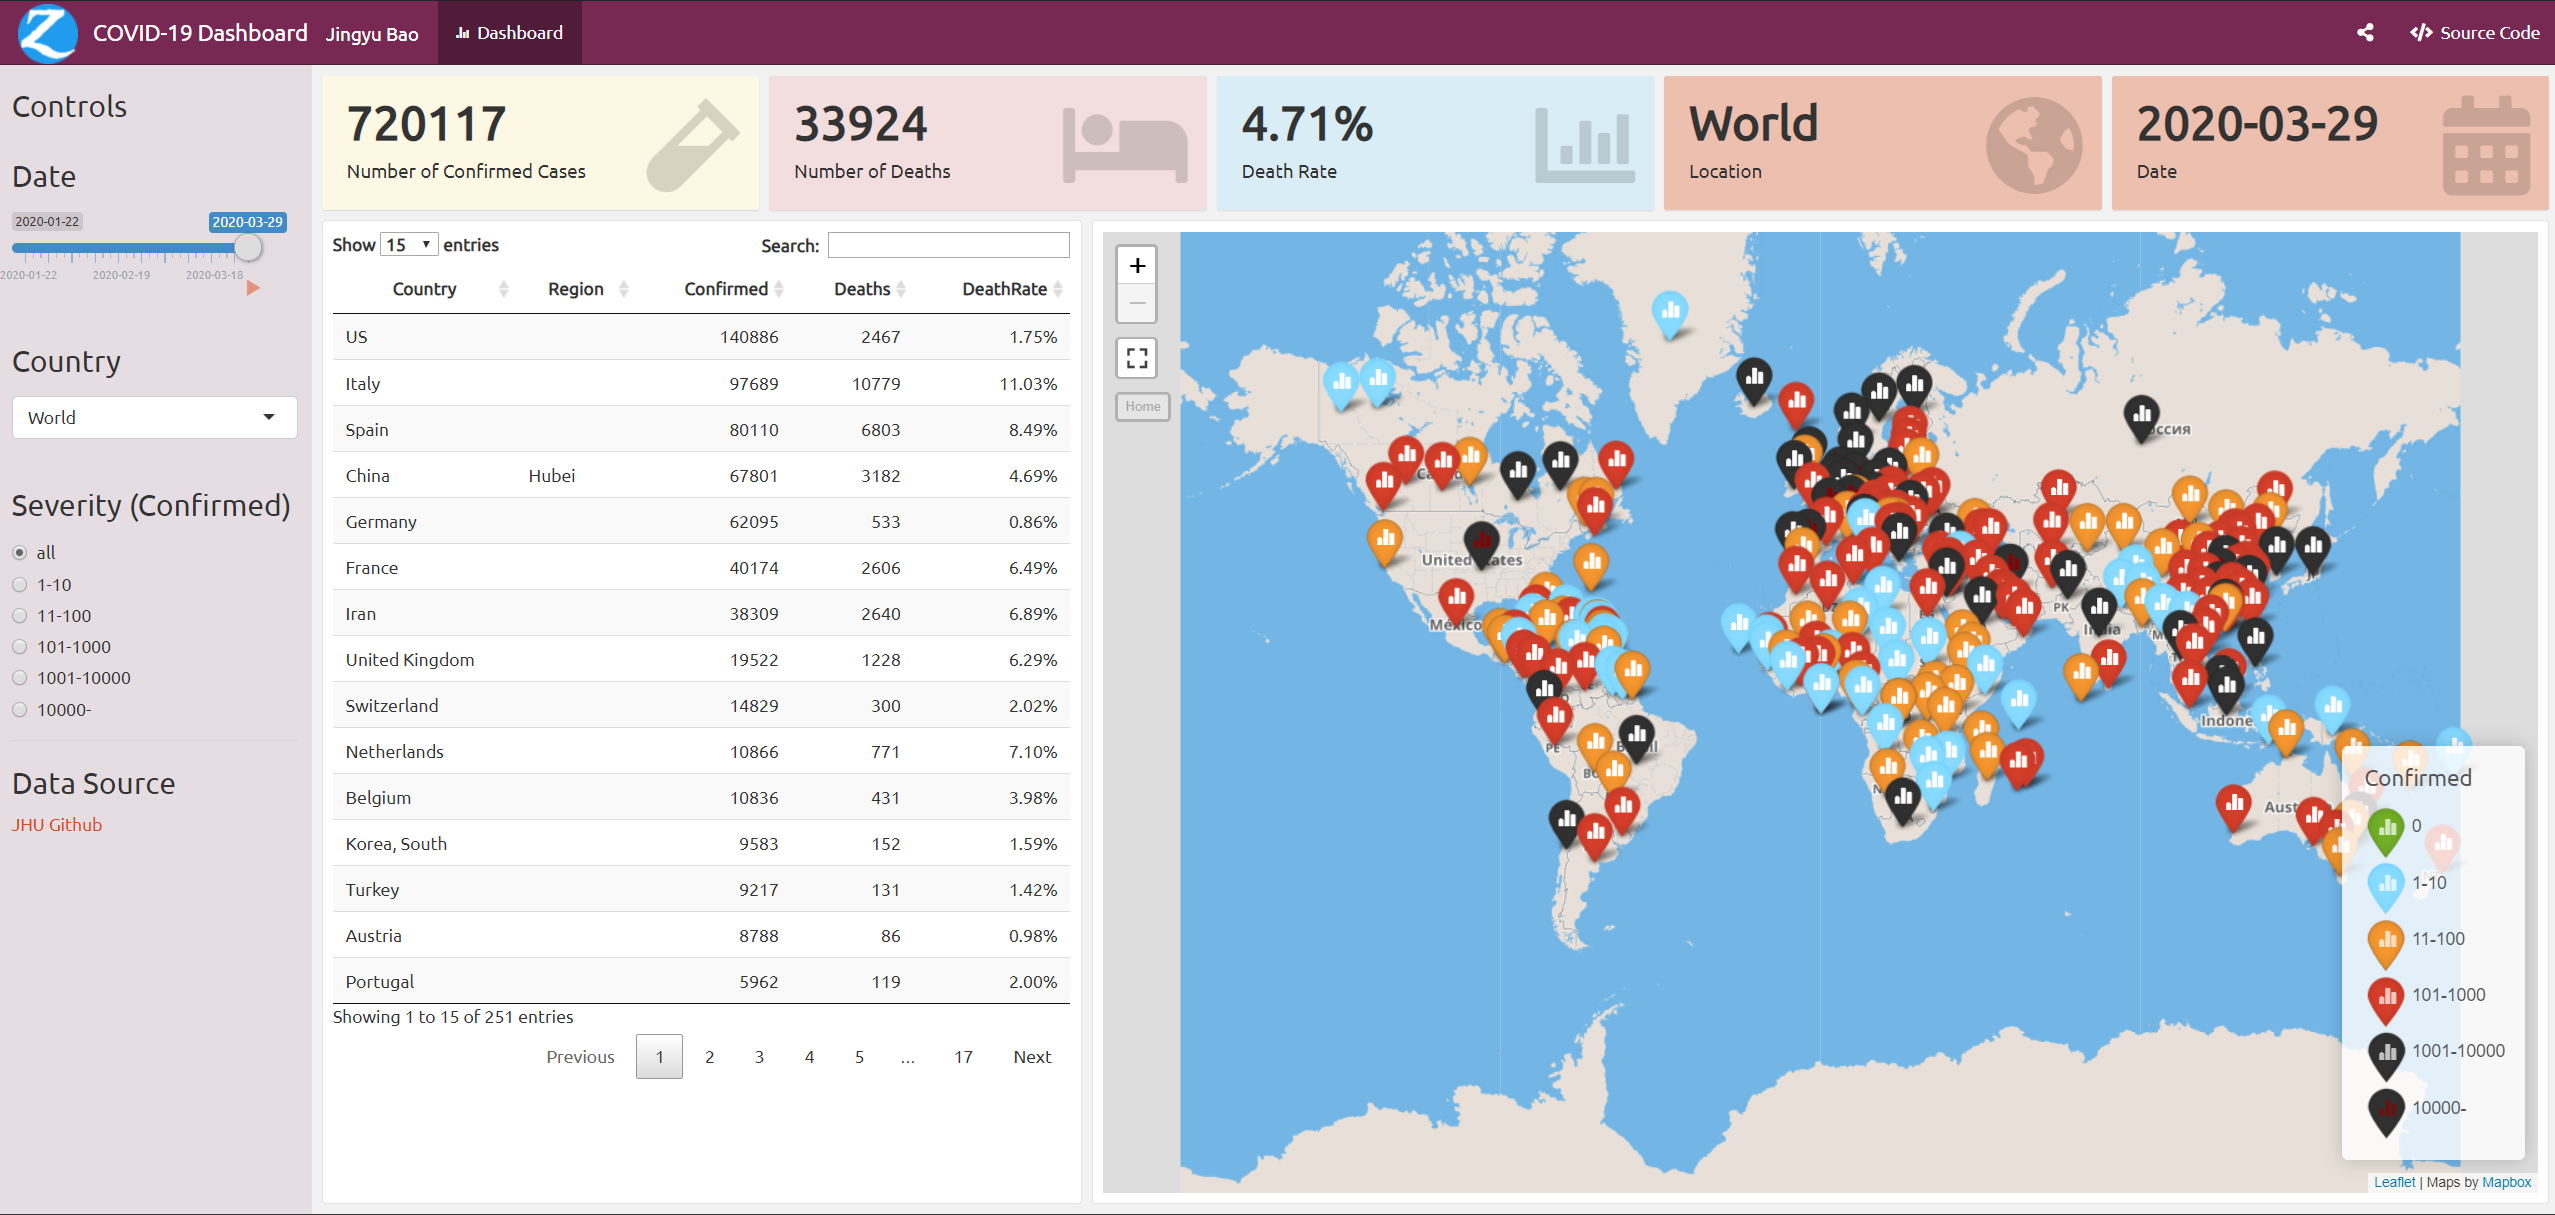
Leaflet Plot (updated on 2020-04-09)
It’s a 5-level leaflet plot.
Navigate the map in landscape mode in mobile device.
DataTable (updated on 2020-04-09)
The current state of COVID-19. Select the device to browse the table.
Geo Plots for China and the World (ggplot + geom_sf, updated on 2020-04-09)
Two types of geo plots here.
- Confirmed (Number of Cumulative Confirmed Cases): the total number of cases in the region, no matter what the current state is, effected, recovered or dead.
- Remaining (Number of Remaining Cases): it’s the number of cumulative confirmed cases subtracts the numbers of recovered and dead cases.
| Cumulative Confirmed Cases |
|---|
 |
 |
| Remaining Cases |
|---|
 |
 |
HTML Plot (ggplotly, updated on 2020-04-09)
Comparing China and outside of China.
The view experience in mobile device will be better if using landscape.
Top 20 Countries Facet Plot (ggplot + facet_wrap, updated on 2020-04-09)
The plots are ranking from the most the the least of the top 20 countries.

Shiny App
This is a shinyapp locating here. The app doesn’t work in some cases. That’s because I only use the free-tier shinyapps.io, whose monthly active hour is 25 hours. So I decided not spend too much time to optimize the view experience in this section.
This simple shiny doesn’t work any more because JHU changed their data format. And I created new shiny app with flexdashboard here.
<div class='iframe-container'>
  <iframe src="https://zhongjzsb.shinyapps.io/covid-19/"></iframe>
</div>